The MRC National Survey of Health of Development (NSHD) assessed their cohort members (CMs) during the study’s age 60-64 sweep using the Reaction Time Test.
Details on this measure and the data collected from the CMs are outlined in the table below.
| Domain: | Reaction time |
| Measures: | Simple reaction time (task 1) |
| Choice reaction time (task 2) | |
| CHC: | Gt (reaction and decision speed) |
| Administration method: | Research nurse; face to face; CAPI |
| Procedure: | Task 1: Using the CAPI, participants were instructed to press a key as quickly as possible every time the numbers '0' or '8' appeared on screen. Participants were instructed to use 1 finger only. There were delays of 1 - 3 seconds between each letter, to avoid anticipation. The test began with 8 practice trials. For the full test, a total of 20 trials were completed. |
| Task 2: Next, the participants were instructed that the numbers '1', '2', '3', and '4' would appear on screen, and they were to press the corresponding keys as quickly as possible; i.e. if a '1' appeared, they were to press '1'. They were instructed to use both hands. Again, there were 8 practice trials, and the full test consisted of 40 trials. | |
| Link to questionnaire: | https://skylark.ucl.ac.uk/NSHD/lib/exe/fetch.php?media=questionnaires:2008_nurse.pdf (opens in new tab) |
| Scoring: | Mean reaction time of correct trials |
| Item-level variable(s): | K0ER09 - K4SD09 |
| Total score/derived variable(s): | RTMN09, RTSD09 |
| Descriptives: | Mean reaction time |
| N = 2,167 | |
| Range = 41 - 849 | |
| Mean = 286.11 | |
| SD = 68.48 | |
(click image to enlarge)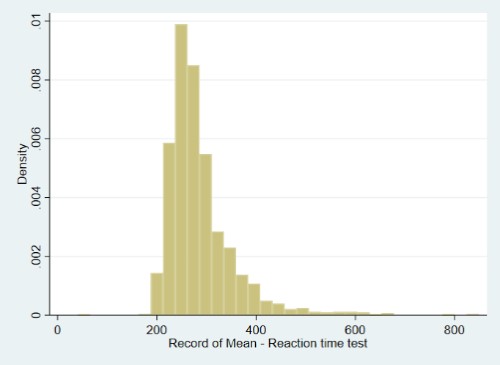 |
|
| Age of participants (months): | Mean = 760.24, SD = 13.36, Range = 724 - 780 |
| Other sweep and/or cohort: | None |
| Source: | Generic reaction time test. Similar reaction time tests have been widely used in psychology for well over a century, e.g. Cattell (1890). |
| Technical resources: | Masi, S., Georgiopoulos, G., Khan, T., Johnson, W., Wong, A., Charakida, M., ... & Deanfield, J. (2018). Patterns of adiposity, vascular phenotypes and cognitive function in the 1946 British Birth Cohort. BMC Medicine, 16(1), 75. |
| Reference examples: | Masi, S., Georgiopoulos, G., Khan, T., Johnson, W., Wong, A., Charakida, M., ... & Deanfield, J. (2018). Patterns of adiposity, vascular phenotypes and cognitive function in the 1946 British Birth Cohort. BMC Medicine, 16(1), 75. |
For the named items in the table above, links are provided to their corresponding content on CLOSER Discovery. Where a variable range is provided, full variable lists can be accessed through the ‘Variable Groups’ tab on the linked Discovery page.
Go to:
- Overview of all cognitive measures in NSHD
- Overview of adulthood cognitive measures across all studies
This page is part of CLOSER’s ‘A guide to the cognitive measures in five British birth cohort studies’.